:(){ :|:& };:

Compile for pandaboard

An easier way than cross-compiling is to use mk-sbuild[1]/schroot[2]
For example, pandaboard is an hard-float arm, so you can create a chroot for it with:

  mk-sbuild --arch=armhf --name=arm-linux-gnueabi \
 --debootstrap-mirror=http://ports.ubuntu.com/ precise

When the process is done, you’ll get something like:

  To CHANGE the golden image: sudo schroot -c arm-linux-gnueabi-armhf-source -u root                                                                                                      
  To ENTER an image snapshot: schroot -c arm-linux-gnueabi-armhf                                                                                                                          
  To BUILD within a snapshot: sbuild -A -d arm-linux-gnueabi-armhf PACKAGE*.dsc

The chroot will be placed in

  /var/lib/schroot/chroots/arm-linux-gnueabi-armhf

Now you can enter the image and compile your code, w/o going through all the –host/–target cross-compiling hassle.

In case you need to check if an ELF was compiled for armhf, you can run

readelf -A /path/to/binary | grep Tag_ABI_VFP_args

If compiled for armhf, you should see something like:

  Tag_ABI_VFP_args: VFP registers

References:
[1] https://wiki.debian.org/mk-sbuild
[2] https://wiki.debian.org/Schroot

brief intro to libhybris

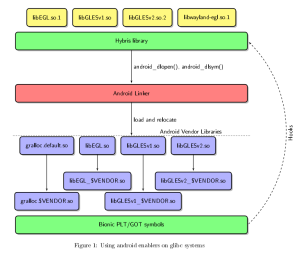
One of libhybris’s use cases is to implement a GNU/Linux graphic stack, using Android proprietary drivers.
By graphic stack I mean the API for EGL, Wayland-egl and GLES{v1,v2} (yellow boxes).

g145391

Most of functions in the *GL libraries will call in android_dlopen/android_dlsym, for example:

EGLBoolean eglGetConfigs(EGLDisplay dpy, EGLConfig *configs,
    EGLint config_size, EGLint *num_config)
{
    EGL_DLSYM(&_eglGetConfigs, "eglGetConfigs");
     return (*_eglGetConfigs)(dpy, configs, config_size, num_config);
}

android_dlopen/android_dlsym come from mostly-unmodified android linker code, so it will load and relocate the android libraries just as on a real devices.
While the library relocation takes place, any reference to a bionic symbol is redirected(hooked) toward an adaptation function.
That’s because some “struct”s or “enum”s are defined differently in bionic than in glibc or the function behaviour is different:

static void *my_memcpy(void *dst, const void *src, size_t len)                                                                                                                           
{                                                                                                                                                                           
    if (src == NULL || dst == NULL)                                                                                                                                                      
         return NULL;                                                                                                                                                                     
     return memcpy(dst, src, len);                                                                                                                                                        
} 

For more details, I strongly recommend reading Carstens’ blog

Android OpenGL ES Tracer

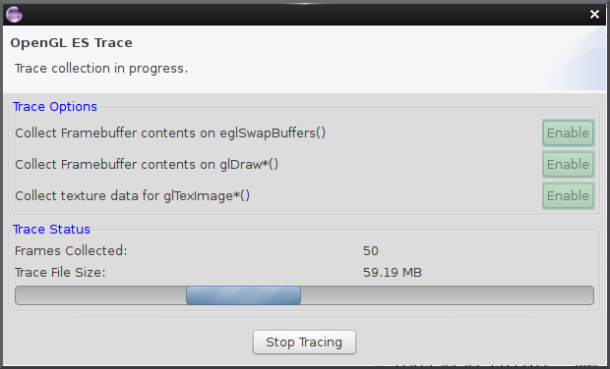
It’s an Eclipse plugin and a shared library that let you trace the GLES calls performed by an application. Texture data and framebuffer can also be extracted, but as expected, they add a noticeable overhead.

The code producing the traces is found in frameworks/native/opengl/libs/GLES_trace/
which is compiled into libGLES_trace.so
You then control and gather data using the Eclipse plugin :
sdk/eclipse/plugins/com.android.ide.eclipse.gldebugger/src/com/android/ide/eclipse/gltrace/
Now that you have an rough idea where to find the source code, I’ll detail the way it’s working.
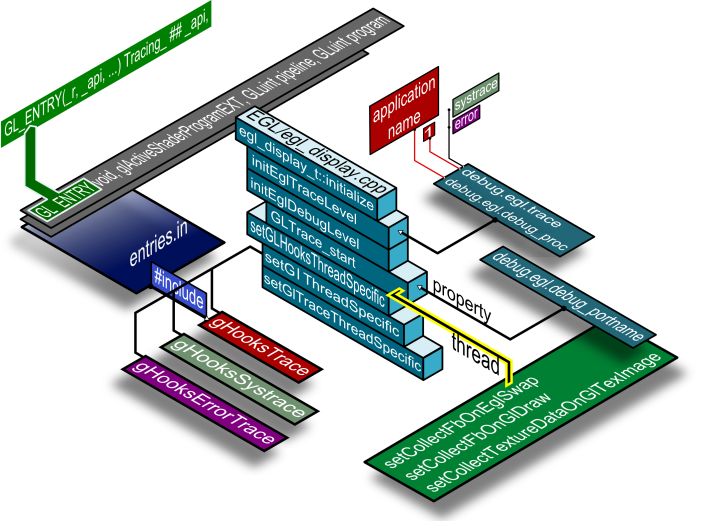
ImageIt all starts in Android’s EGL library, the display initialization code (the top level of the blue call-stack) calls initEglTraceLevel to check if the EGL library is supposed to do any tracing
and if yes, what type of tracing.
All this information comes thru the Android Properties system

Tracing options

The type of tracing is controlled by the debug.egl.trace property, which can
take three values:
  1. systrace
  2. error
  3. number 1

1. When debug.egl.trace is systrace, then the GLES calls are redirected to the Systrace subsystem

2. If debug.egl.trace is error, the tracer will log (logcat log) the errors in the GLES functions plus a callstack.

3. Setting debug.egl.trace to 1 will redirect the tracing to Android log (logcat again).
Here though, if you also set debug.egl.debug_proc to a valid process name, then
only that application will be traced, and the collected data will be sent to your developing machine.

Interface with the host machine

You can see that initEglDebugLevel calls GLTrace_start that spawns a thread. This thread services requests coming from the eclipse plugin, namely from the green highlights below. The communication port is specified in debug.egl.debug_portname.ImageThis connection is then reused for sending the collected traces back to the host machine.

How is tracing done

In Fig.1 you can see that the type of tracing has the same color-coding with some structures: gHooksTrace, gHooksSystrace and gHooksErrorTrace. These structures looks something like this

#define GL_ENTRY(_r, _api, ...) GLTrace_ ## _api,
 EGLAPI gl_hooks_t gHooksDebug = {
    {
      #include "entries.in"
    },
    {
       {0}
    }
 };
#undef GL_ENTRY

entries.in contains the list of GL functions together with their signatures (see glActiveShaderProgramEXT in Fig.1). How is entries.in expanded, depends on how GL_ENTRY is defined. This definition is basically the trick used to generate three types of data structures(for each type of tracing) starting from the same list of functions.

The same entries.in is reused by GLES_trace/src/genapi.py to generate wrapping functions such as the one below(glFlush). You can see how the timing is done and later on sent to the host with  glContext->traceGLMessage(&glmsg). The communication between device and host is marshalled/serialized using Google’s protobuf.

 void GLTrace_glFlush(void) {
     GLMessage glmsg;
     GLTraceContext *glContext = getGLTraceContext();

     glmsg.set_function(GLMessage::glFlush);

     // call function
     nsecs_t wallStartTime = systemTime(SYSTEM_TIME_MONOTONIC);
     nsecs_t threadStartTime = systemTime(SYSTEM_TIME_THREAD);
     glContext->hooks->gl.glFlush();
     nsecs_t threadEndTime = systemTime(SYSTEM_TIME_THREAD);
     nsecs_t wallEndTime = systemTime(SYSTEM_TIME_MONOTONIC);

     void *pointerArgs[] = {
     };

     fixupGLMessage(glContext, wallStartTime, wallEndTime,
                               threadStartTime, threadEndTime,
                               &glmsg, pointerArgs);
     glContext->traceGLMessage(&glmsg);
 }

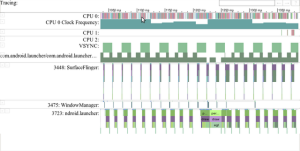
Systrace

Now, a bit on the systrace tool.
systrace

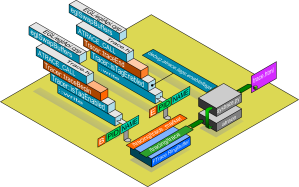
It’s based on the trace_marker mechanism. This means that a program can write to $DEBUGFS/tracing/trace_marker, and whatever text it wrote to that,
it will appear in $DEBUGFS/tracing/trace.
So, in Trace.h, a helper macro is defined, ATRACE_CALL() which allocates a Tracer object on stack.
In its constructor, traceBegin is called, while in its destructor, traceEnd.
After a check to see what tracing tag is enabled, each of the two functions (traceBegin and traceEnd)
will write a string to $DEBUGFS/tracing/trace_marker.
The string looks like “B|getpid()|__func__” for traceBegin
and “E|getpid()|__func__” for traceEnd.

At a later stage, systrace.py reads the trace buffer(the green path in the diagram) using the atrace tool found on device, and puts it in an HTML file.
The generated HTML parses the trace content and provide a nice view of the trace.

SystraceScreenshot__cropped__large_verge_medium_landscape

Jelly Bean Codec infrastructure, part1

By default, Android provides you with libraries that does software encoding/decoding.
If you want to enable platform specific codecs, you’ll first need to write a media_codecs.xml.
That’s a map from MediaCodec onto mime-types and informs libstagefright what codec to use for a specific mime-type.

Now, in your encoder library, you’ll need to call:

// OMXVideoEncoderMPEG4 is the Class Name that implements the Video Encoder
DECLARE_OMX_COMPONENT("OMX.My.VideoEncoder.MPEG4", "video_encoder.mpeg", OMXVideoEncoderMPEG4);

So far, the link between mime-type and what object to use is set.
Now Android has to have a way of calling in the platform specific encoder library.
This is done in OMXMaster.cpp.
Android expects for libstagefrighthw.so to be provided by the vendor.
Using dlopen, it gets a handle to the shared library, and calls createOMXPlugin() or android::createOMXPlugin().

Later on, I’ll detail the structure of the object returned by createOMXPlugin().

on-demand callstack on android Jelly Bean

Up to Jelly Bean, there were no means to obtain the callstack in a programmatic.
You could use libunwind or try to crash your process so you could trigger debuggerd, but that was it.

Now Jelly Bean offers the android::CallStack class. You can find it in frameworks/native/libs/utils/CallStack.cpp.

It will log the callstack using logcat:

D/CallStack( 8043): (null)#00  pc 00000731  /system/bin/test-callstack
D/CallStack( 8043): (null)#01  pc 000005db  /system/bin/test-callstack
D/CallStack( 8043): (null)#02  pc 00019929  /system/lib/libc.so
D/CallStack( 8043): (null)#03  pc 0000060d  /system/bin/test-callstack

As example, the first line is translated into file:line using

addr2line -e ${ANDROID_PRODUCT_OUT}/symbols/system/bin/test-callstack 00000731

The code snippet looks like this:

// android::CallStack::dump() uses ALOGD, so DEBUG needs to be defined
#define DEBUG
#include <CallStack.h>
...
    android::CallStack a;
    a.update();
    a.dump();
...

ION Buffer sharing mechanism

ION is a memory manager introduced by Google in Android ICS v4.0 to facilitate buffer-sharing.

When a buffer is shared by two components, the memory copies are eliminated, thus achieving zero-memory-copy.

Through this framework, one can allocate, free, share or import a memory buffer;
the latter can either live in main memory (CPU addressable) or on other device-specific memory.

The layer doing the actual memory allocation is called a ”heap” and it resides in the kernel.

Since ION can be used from kernelspace or userspace, a set of IOCTLs are used to communicate.

ION allows you to have multiple memory allocators (vmalloc, kmalloc, carveout (genalloc) or CMA) but using a single API.

This abstraction can be used for power-savings by turning off unused memory banks; for example lets suppose you can have 2 carveout heaps:
one with id=0 on DDR bank 0
one with id=1 on DDR bank 1.
An ION client can ask for memory coming from one of the carveout heap and, when  possible, the allocations are done in heap id=0 so you can shutdown DDR bank 1 because heap id=1 isn’t used.

Userspace Usage

Typically, the HALs will use ION to allocate large contiguous media buffers (See [[Contiguous_Memory_Allocator|CMA]])

and share those between hardware components. You can see the OMAP use-case below.

The userspace-kernel communication is done using ”’/dev/ion”’ as an entry point for the following IOCTLs:

 ION_IOC_ALLOC : allocate memory. Not yet CPU accessible
 ION_IOC_FREE  : free memory
 ION_IOC_MAP   : get a file descriptor to mmap
 ION_IOC_SHARE : creates a file descriptor to use to share an allocation
 ION_IOC_IMPORT : imports a shared file descriptor
 ION_IOC_CUSTOM : architecture specific ioctl. this is used to implement platform specific functionality.
            +----+       +----+           +----+
            |HAL1|       |HAL2|           |HAL3|
            +---++       +-+--+           +--+-+
                |          |                 |
                |          |                 |  ioctl(/dev/ion)
                |          |                 |  buffer sharing
                |          |                 |  buffer allocation
                |          |                 |
                |          |                 |
                +--------+ |  +--------------+
                         | |  |
                         | |  |
                       +-+-+--+-+                         +----------------+
                       |ION Core|<------------------------+omap framebuffer|
                       +-+-+-+-++    client registration  +----------------+
                         | | | |     buffer allocation
                         | | | |     buffer sharing
                         | | | |
                         | | | +-----------------------------------------------------+
          +--------------+ | |                                                       |
          |                | +-------------------------------+                       |
          |                |                                 |                       |
      +---+-------+    +---+-------------------+   +---------+-----------+   +-------+--------+
      |system heap|    |system contiguous heap |   |carveout heap        |   |omap tiler heap |
      |uses vmalloc    |uses kmalloc           |   |uses preserved memory|   |                |
      +-----------+    +-----------------------+   +---------------------+   +----------------+

Userspace API

Android provides a library, in ”system/core/libion’,’ that maps the IOCTLs to C functions.

//Returns an ION control file descriptor.
ion_open()

//Close an ION control file descriptor.
ion_close(int fd)

//Allocate a shared-buffer handler. The shared-buffer is not yet accessible from CPU.
ion_alloc(int fd, size_t len, size_t align, unsigned int flags, struct ion_handle **handle)

//Free a memory buffer.
ion_free(int fd, struct ion_handle *handle)

//Get a file descriptor to mmap.
ion_map(int fd, struct ion_handle *handle, size_t length, int prot,int flags, off_t offset, unsigned char **ptr, int *map_fd)

//Create a file descriptor to be used for sharing a buffer.
ion_share(int fd, struct ion_handle *handle, int *share_fd)

//Import a shared file descriptor and creates a ion_handle for it.
ion_import(int fd, int share_fd, struct ion_handle **handle)

//It's based on an ION_IOC_CUSTOM ioctl and it calls into the OMAP Heap.
ion_alloc_tiler(int fd, struct ion_handle *handle, size_t length, int prot,int flags, off_t offset, unsigned char **ptr, int *map_fd)
</pre>
<h3> Kernel API</h3>
<pre>
Kernel drivers can register themself as "clients" of the ION allocator and specify through a bit-mask what type of heap(s) they want to use. The Kernel API consists of the folowing functions:


//allocate an ion_client and returns it, dev beeing the global ION device.
ion_client_create(struct ion_device *dev,unsigned int heap_mask, const char *name)

//free's a ion_client and all it's handles
ion_client_destroy(struct ion_client *client)

//allocate ion memory, it return an opaque handle it
ion_alloc(struct ion_client *client, size_t len,size_t align, unsigned int flags)

//free a handle
ion_free(struct ion_client *client, struct ion_handle *handle)

//returns the physical address and len of a handle
ion_phys(struct ion_client *client, struct ion_handle *handle,ion_phys_addr_t *addr, size_t *len)

//return an sg_table describing a handle
ion_sg_table(struct ion_client *client,struct ion_handle *handle)

//create mapping for the given handle
ion_map_kernel(struct ion_client *client, struct ion_handle *handle)

//destroy a kernel mapping for a handle
ion_unmap_kernel(struct ion_client *client, struct ion_handle *handle)

//given an ion client, create a dma-buf fd
ion_share_dma_buf(struct ion_client *client, struct ion_handle *handle)

//given an dma-buf fd from the ion exporter get handle
ion_import_dma_buf(struct ion_client *client, int fd)

Adding a new type of heap

By default, the ION driver offers three types of heap. The intention is for the sets of heaps and mappers to grow to cover the use cases as they appear.

# ION_HEAP_TYPE_SYSTEM: memory allocated via vmalloc_user
# ION_HEAP_TYPE_SYSTEM_CONTIG: memory allocated via kzalloc
# ION_HEAP_TYPE_CARVEOUT: carveout memory is physically contiguous and set aside at boot

Custom heaps can also be implemented, as seen in the OMAP tiler(drivers/gpu/ion/omap/omap_tiler_heap.c)

ION heap provider must implement the following set of callbacks:

 struct ion_heap_ops {
 int   (*allocate) (struct ion_heap *heap
                    ,struct ion_buffer *buffer
                    ,unsigned long len
                    ,unsigned long align
                    ,signed long flags);
 void  (*free) (struct ion_buffer *buffer);
 int   (*phys) (struct ion_heap *heap
                    ,struct ion_buffer *buffer
                    ,ion_phys_addr_t *addr
                    , size_t *len);
 struct scatterlist* (*map_dma) (struct ion_heap *heap
                    ,struct ion_buffer *buffer);
 void  (*unmap_dma) (struct ion_heap *heap
                    ,struct ion_buffer *buffer);
 void* (*map_kernel) (struct ion_heap *heap
                    ,struct ion_buffer *buffer);
 void  (*unmap_kernel) (struct ion_heap *heap
                    ,struct ion_buffer *buffer);
 int   (*map_user) (struct ion_heap *heap
                    ,struct ion_buffer *buffer
                    ,struct vm_area_struct *vma);
 };

OMAP4 Usage

ION is used on OMAP to share buffers between the camera and the codecs. These devices are separate entities, and don’t have a memory of their own

A chunk of system memory is allocated by the Camera MemoryManager which is populated with the frames it captures.

DOMX is then used communicate with the codec unit. The unit will read the shared memory zone and encode/decode it.
The content of the shared buffers can be image data, or gralloc surface IDs, when the scenario involves the framebuffer as well.

Camera HAL

/hardware/ti/omap4xxx/camera/MemoryManager.cpp

void* MemoryManager::allocateBuffer(int width, int height, const char* format, int &bytes, int numBufs)
In this case, ION is used to allocate '''numBufs''' of buffers located in the ION_HEAP_TYPE_CARVEOUT heap.
:called by: CameraHal::allocImageBufs
:called by: CameraHal::allocPreviewDataBufs

Codec HAL

  /hardware/ti/omap4xxx/''domx''/ 
         domx/omx_proxy_common/src/omx_proxy_common.c                      # The Common Proxy layer of DOMX
         omx_proxy_component/omx_camera/src/omx_proxy_camera.c             # The DOMX Proxy for Camera device
         omx_proxy_component/omx_video_dec/src/omx_proxy_videodec_secure.c # The DOMX Proxy for video decoder

”domx” refers to [http://omappedia.org/wiki/Ducati_For_Dummies Distributed OpenMAX].

domx/omx_proxy_common/src/omx_proxy_common.c

OMX_ERRORTYPE OMX_ProxyCommonInit(OMX_HANDLETYPE hComponent)
:ion_open is called to get the ION control handle.
:the ion control handle is saved into a pCompPrv->ion_fd
 OMX_COMPONENTTYPE *hComp          = (OMX_COMPONENTTYPE *) hComponent;
 PROXY_COMPONENT_PRIVATE *pCompPrv = (PROXY_COMPONENT_PRIVATE *) hComp->pComponentPrivate;
:called by: OMX-Core OMX_ComponentInit.
:::OMX_ComponentInit is implemented in: omx_proxy_h264enc.c, omx_proxy_mpeg4enc.c

OMX_ERRORTYPE PROXY_ComponentDeInit(OMX_HANDLETYPE hComponent)
:calls ion_close.
:called by:LOCAL_PROXY_H264E_ComponentDeInit, LOCAL_PROXY_MPEG4E_ComponentDeInit, PROXY_VIDDEC_Secure_ComponentDeInit

RPC_OMX_ERRORTYPE RPC_RegisterBuffer(OMX_HANDLETYPE hRPCCtx, int fd, struct ion_handle **handle)

:from ”’fd”’ using the ”’ION_IOC_IMPORT”’ ioctl, RPC_RegisterBuffer obtains an ion_handle, ”’handle”’
:!never called


OMX_ERRORTYPE PROXY_AllocateBuffer(OMX_IN OMX_HANDLETYPE hComponent, OMX_INOUT OMX_BUFFERHEADERTYPE ** ppBufferHdr, OMX_IN OMX_U32 nPortIndex, OMX_IN OMX_PTR pAppPrivate, OMX_IN OMX_U32 nSizeBytes)
 @param [in] hComponent
   Handle of the component to be accessed.  This is the component
   handle returned by the call to the OMX_GetHandle function.
 @param [out] ppBuffer
   pointer to an OMX_BUFFERHEADERTYPE structure used to receive.
   the pointer to the buffer header
 @param [in] nPortIndex
   nPortIndex is used to select the port on the component the buffer will
   be used with.  The port can be found by using the nPortIndex
   value as an index into the Port Definition array of the component.
 @param [in] pAppPrivate
   pAppPrivate is used to initialize the pAppPrivate member of the.
   buffer header structure.
 @param [in] nSizeBytes
   size of the buffer to allocate.  Used when bAllocateNew is true.
 @return OMX_ERRORTYPE
   If the command successfully executes, the return code will be
   OMX_ErrorNone.  Otherwise the appropriate OMX error will be returned.

:uses ion_map to make a userspace mapping of the ion handle. The mapping is done onto '''&((*ppBufferHdr)->pBuffer'''
:what does pBuffer buffer contains ?
:called by: LOCAL_PROXY_MPEG4E_AllocateBuffer  when ???
:In OMX-IL, the OMX_AllocateBuffer macro will request that the component allocate a new buffer and buffer header.
:::pBufferHdr->pBuffer = (OMX_U8 *)(pGrallocHandle->fd[0]);

OMX_ERRORTYPE PROXY_UseBuffer(OMX_IN OMX_HANDLETYPE hComponent,
OMX_INOUT OMX_BUFFERHEADERTYPE ** ppBufferHdr,
OMX_IN OMX_U32 nPortIndex, OMX_IN OMX_PTR pAppPrivate,
OMX_IN OMX_U32 nSizeBytes, OMX_IN OMX_U8 * pBuffer)
:uses ion_map to make a userspace mapping of the ion handle.
:what does the mapped buffer contains ?
:called by '''PROXY_AllocateBuffer''' when ???

OMX_ERRORTYPE PROXY_AllocateBufferIonCarveout(PROXY_COMPONENT_PRIVATE *pCompPrv, size_t len, struct ion_handle **handle)
:calls ion_alloc to create an ion_handle:'''handle'''
:called by '''PROXY_AllocateBuffer''' when ???
:called by '''PROXY_UseBuffer''' when ???

OMX_ERRORTYPE PROXY_FreeBuffer(OMX_IN OMX_HANDLETYPE hComponent,OMX_IN OMX_U32 nPortIndex, OMX_IN OMX_BUFFERHEADERTYPE * pBufferHdr)

:called by ??? when ???


GPU Driver

  /omap_kernel/drivers/gpu/pvr/
         module.c, ion.h, ion.c, mm.c
         omaplfb/omaplfb_displayclass.c
  /omap_kernel/drivers/rpmsg/rpmsg_omx.c

OMAP Use Case

The OMAP kernel uses the ION allocator to share a buffer between the framebuffer device driver and the TILERTiling and Isometric Lightweight Engine for Rotation. The tiler unit enables video rotation on OMAP4 and Netra chips.

Debugging

The ION Allocator exports heap information through debugfs. Heap information is keyed after the PID and can be dumped like:

 cat /sys/kernel/debug/ion/ion-heap-1
 cat /sys/kernel/debug/ion/PID

External links

CMA Integration on ION
ION architecture documentation
basic test for ION heaps
test application

Android 4.1 (Jelly Bean) new tools

In 4.1 arm emulator image there are a couple of new tools: schedtop, atrace, latencytop,

/system/bin/schedtop output looks something like:

   TID    -------- SINCE LAST --------       ------------- TOTAL -------------
  PID     EXEC_TIME   DELAY_TIME SCHED       EXEC_TIME      DELAY_TIME   SCHED NAME
    1   0.000000000  0.000000000     0     3.029379557     0.408314327     216 /init
    2   0.000000000  0.000000000     0     0.005235383     0.012034906      51 kthreadd
    3   0.001637475  0.005042099     3     0.014593854     0.104118138      61 ksoftirqd/0
    4   0.001257789  0.000313636     2     0.336109346     0.411691037    1564 events/0
    5   0.000000000  0.000000000     0     0.000000000     0.030000001       2 khelper
    6   0.000000000  0.000000000     0     0.000000000     0.020000001       2 suspend
    7   0.000000000  0.000000000     0     0.000000000     0.010000000       2 kblockd/0

and it doesn’t look like this schedtop

Latencytop raises an error when run, but I figure it has something to do with some un-mounted filesystem.
I’ll have to see if it’s the same latencytop we all know

# latencytop
latencytop
Could not open /proc/sys/kernel/latencytop: No such file or directory

atrace also spits errors of missing debugfs:

# atrace
atrace
error opening /sys/kernel/debug/tracing/options/overwrite: No such file or directory (2)
error opening /sys/kernel/debug/tracing/events/sched/sched_switch/enable: No such file or directory (2)
error opening /sys/kernel/debug/tracing/events/sched/sched_wakeup/enable: No such file or directory (2)
error opening /sys/kernel/debug/tracing/events/power/cpu_frequency/enable: No such file or directory (2)
error opening /sys/kernel/debug/tracing/events/power/cpu_idle/enable: No such file or directory (2)
error opening /sys/kernel/debug/tracing/buffer_size_kb: No such file or directory (2)
error opening /sys/kernel/debug/tracing/trace_clock: No such file or directory (2)

Now, in the SDK 2.0 directory, you can find systrace, a python script that does, I quote:

"""Android system-wide tracing utility.

This is a tool for capturing a trace that includes data from both userland and
the kernel.  It creates an HTML file for visualizing the trace.

It uses the atrace from the target to collect information about the disk, CPU, workqueue
and it nicely tag them:

  'gfx':      1<<1,
  'input':    1<<2,
  'view':     1<<3,
  'webview':  1<<4,
  'wm':       1<<5,
  'am':       1<<6,
  'sync':     1<<7,
  'audio':    1<<8,
  'video':    1<<9,
  'camera':   1<<10,

One thing that caught my eye in the systrace.py, is this line:
# This list is based on the tags in frameworks/native/include/utils/Trace.h
I wonder what other goodies lies in that frameworks/native/utils directory ?

Systemtap

I caught the systemtap bug. Not a software bug, but the one that makes you think of a thing every minute of the day.

One nice thing I come up while searching for more systemtap on the net, was this paper from Josh Stone that describes a marriage between dyninst and systemtap.

That would get rid of the permission problems (insmod and stuff)

Compiling Dehydra and Treehydra on Natty Narwhal

While Dehydra is available as a package, it doesn’t contain treehydra.
So, the only other option is to have it compiled from sources.
One thing to note here is that the latest Dehydra requires xulrunner 2.0.

#Pre-requisites
sudo apt-get update
sudo apt-get install gcc-4.5
sudo apt-get install gcc-4.5-plugin-dev
sudo apt-get install xulrunner-2.0-dev

#Compiling
hg clone http://hg.mozilla.org/rewriting-and-analysis/dehydra/
cd dehydra

export CXX="`which g++-4.5`"
export CC="`which gcc-4.5`"

./configure \
        --js-libs=/usr/lib/xulrunner-2.0 \
        --js-headers=/usr/include/xulrunner-2.0 \
        --enable-C \

make